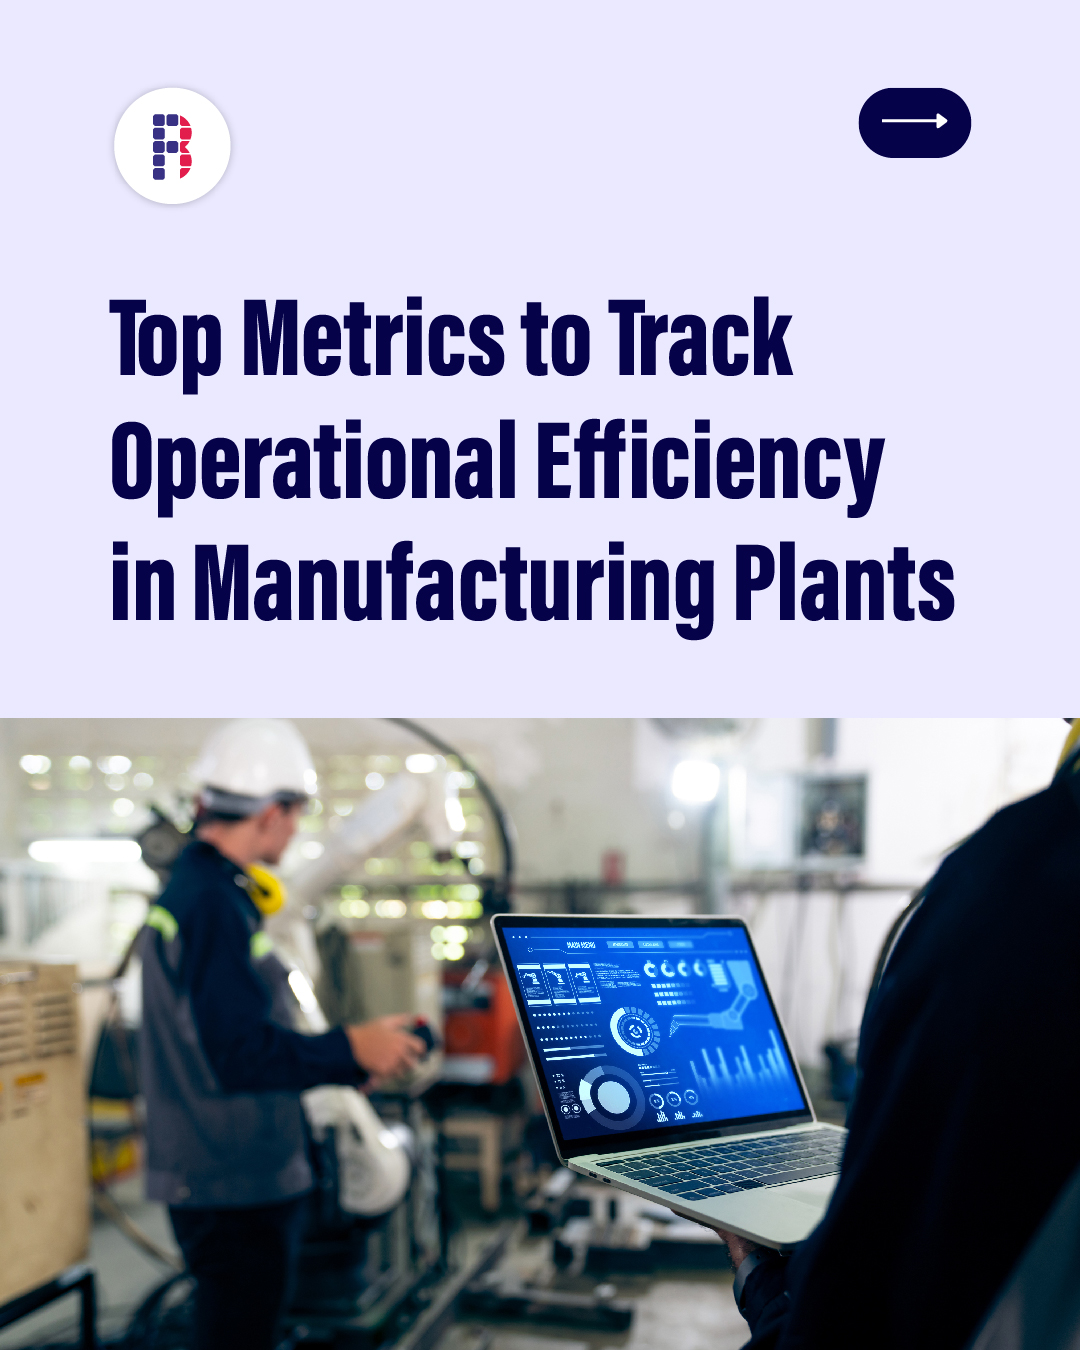
Operational efficiency is the heartbeat of any manufacturing plant. For a specialized solutions provider like Beyzon Foodtek, where we offer cutting-edge food processing and packaging systems, optimizing plant operations is critical to delivering consistency, quality, and reliability to clients across the food industry.
But what exactly does “operational efficiency” mean in a modern manufacturing setup? It means producing more with less- less time, less waste, fewer breakdowns, and fewer errors. It’s about running a plant like a well-oiled machine.
To measure that, manufacturers rely on certain Key Performance Indicators (KPIs) that give a clear picture of what’s working – and what’s not.
In this blog, we explore the top metrics every manufacturing plant should monitor to improve efficiency, ensure sustainability, and boost long-term profitability.
1. Overall Equipment Effectiveness (OEE)

OEE is a widely used metric that combines three key factors: availability, performance, and quality. It tells you how effectively a machine or production line is being used.
A high OEE score means equipment is running when it should, as fast as it should, and producing good-quality output. For food processing environments, where hygiene and speed are both critical, this metric becomes especially important.
2. First Pass Yield (FPY)
FPY shows how many products pass inspection the first time, without needing rework. In other words, how many things are done right the first time.
This metric is crucial for maintaining product quality and reducing waste. For food manufacturers, where reprocessing isn’t always possible or economical, FPY becomes a strong indicator of process reliability.
3. Capacity Utilization Rate
This metric reveals how much of your available production capacity is being used.
If your plant is running far below its potential, you’re likely losing money. On the other hand, if you’re constantly maxed out, you might risk burnout or equipment stress. The right balance helps plan production more strategically.
4. Cycle Time
Cycle time refers to how long it takes to produce one unit from start to finish. Faster cycle times, when managed properly, usually mean greater efficiency and throughput.
In a fast-moving industry like food processing, reducing cycle time can directly impact freshness, shelf life, and speed to market.
5. Inventory Turnover Ratio

This shows how quickly raw materials or finished goods move through your plant. In food manufacturing, slower turnover may indicate overstocking or spoilage risk, while faster turnover suggests good demand forecasting and lean operations.
6. Overall Labor Effectiveness (OLE)
OLE measures how efficiently your workforce is being utilized. It accounts for whether employees are working when scheduled, performing tasks at the right speed, and maintaining quality.
In highly automated settings, OLE helps bridge the human-machine productivity equation.
7. Downtime
Any unplanned stoppage in production – whether due to equipment failure, material delays, or setup time – falls under downtime.
Reducing downtime increases plant availability and productivity closely helps identify patterns and root causes, so corrective action can be taken.
8. Scrap Rate
This refers to the amount of waste generated during the manufacturing process. In food processing, this could mean raw material that’s not used, or finished products that don’t meet quality standards.
High scrap rates increase costs and suggest underlying quality or process issues.
9. On-Time In Full (OTIF) Delivery Rate
A reliable plant delivers products On Time In Full, every time. This metric reflects how often customer orders are fulfilled by the promised date.
Timely delivery builds trust and ensures better supply chain performance, especially when working with large retailers or food service clients.
10. Energy Consumption per Unit
This metric highlights how much energy is used to produce each unit of output. With growing emphasis on sustainability, energy efficiency is becoming a benchmark for operational excellence.
Tracking energy usage allows manufacturers to make smart investments in technology and process improvements.
11. Maintenance Metrics (MTTR & MTBF)
Two important maintenance KPIs – 1. Mean Time To Repair (MTTR) – average repair time and 2. Mean Time Between Failure (MTBF) – average time between equipment breakdowns – provides insights into the health of your machines and the effectiveness of your maintenance strategies.
For food processors, preventive maintenance is key to avoiding downtime and contamination risks.
12. Throughput
Throughput is the number of units produced in a given time. It reflects how productive your plant is and can help identify whether your bottleneck is in machinery, manpower, or materials.
It’s especially useful when scaling operations or launching new product lines.
13. Yield
Yield shows how much top quality saleable product is generated from raw materials. In food manufacturing, higher yield means better control over processes and less raw material waste.
Monitoring yield helps improve recipe standardization, machine settings, and portion control.
14. Changeover Time
Every time you switch from making one product to another, there’s a setup period – known as changeover time.
Reducing changeover time means more productive hours on the line and greater flexibility in meeting diverse customer demands.
A lean tool known as Single Minute Exchange Of Die (SMED) is used to reduce the time between equipment changeover.
15. Customer Complaints or Returns

Tracking complaints and product returns helps monitor quality from the customer’s perspective. Even if internal metrics look good, high return rates or complaints signal that something isn’t translating into real-world performance.
This metric helps close the loop between factory and end user.
Making Metrics Meaningful
For KPIs to actually improve performance, they must be:
- Regularly monitored
- Shared across teams
- Tied to specific goals
- Used for decision-making
Technology plays a huge role in this. Automated systems, smart sensors, and data dashboards can help collect and visualize KPI data in real time.
When everyone – from the floor technician to the plant manager – is aligned on the same numbers, performance improves naturally.
Final Thoughts
For manufacturing plants – especially in food production – the difference between good and great often lies in the numbers.
KPIs like OEE, yield, cycle time, and scrap rate don’t just measure productivity; they uncover hidden inefficiencies and guide smart decisions.
At Beyzon Foodtek, we believe that operational excellence begins with clarity. By helping our clients implement the right tracking systems and automation technologies, we ensure that every machine, every person, and every minute adds value to the production process.
Whether you’re producing ready-to-eat meals, frozen snacks, or dry food mixes, tracking these metrics consistently can take your manufacturing game to the next level.
FAQ’s
1. Why are KPIs important for manufacturing plants?
KPIs help manufacturers identify inefficiencies, reduce waste, improve productivity, and make better business decisions. They provide a data-driven foundation for continuous improvement.
2. How often should operational metrics be reviewed?
Operation metric must be reviewed every single day. This should be reviewed weekly or monthly by the Senior Manager Operations.
3. What’s the difference between OEE and throughput?
OEE measures the efficiency of equipment based on availability, performance, and quality. Throughput focuses purely on how much product is made over a period of time. Both are valuable, but they highlight different aspects of equipment & production efficiencies.
4. Can smaller food manufacturers also benefit from KPI tracking?
Absolutely. Even small to very large sized plants can gain tremendous insights by tracking just a handful of core metrics. It helps them scale smarter and reduce unnecessary costs.
5. How can Beyzon Foodtek help improve my plant’s efficiency?
Beyzon provides turnkey food processing and packaging systems designed with built-in automation, monitoring features & Intelligent Plant Framework to get real time dashboarding of KPI’s. We also offer consulting to help plants implement KPI-driven operational strategies tailored to their specific product lines.